


Table of Contents
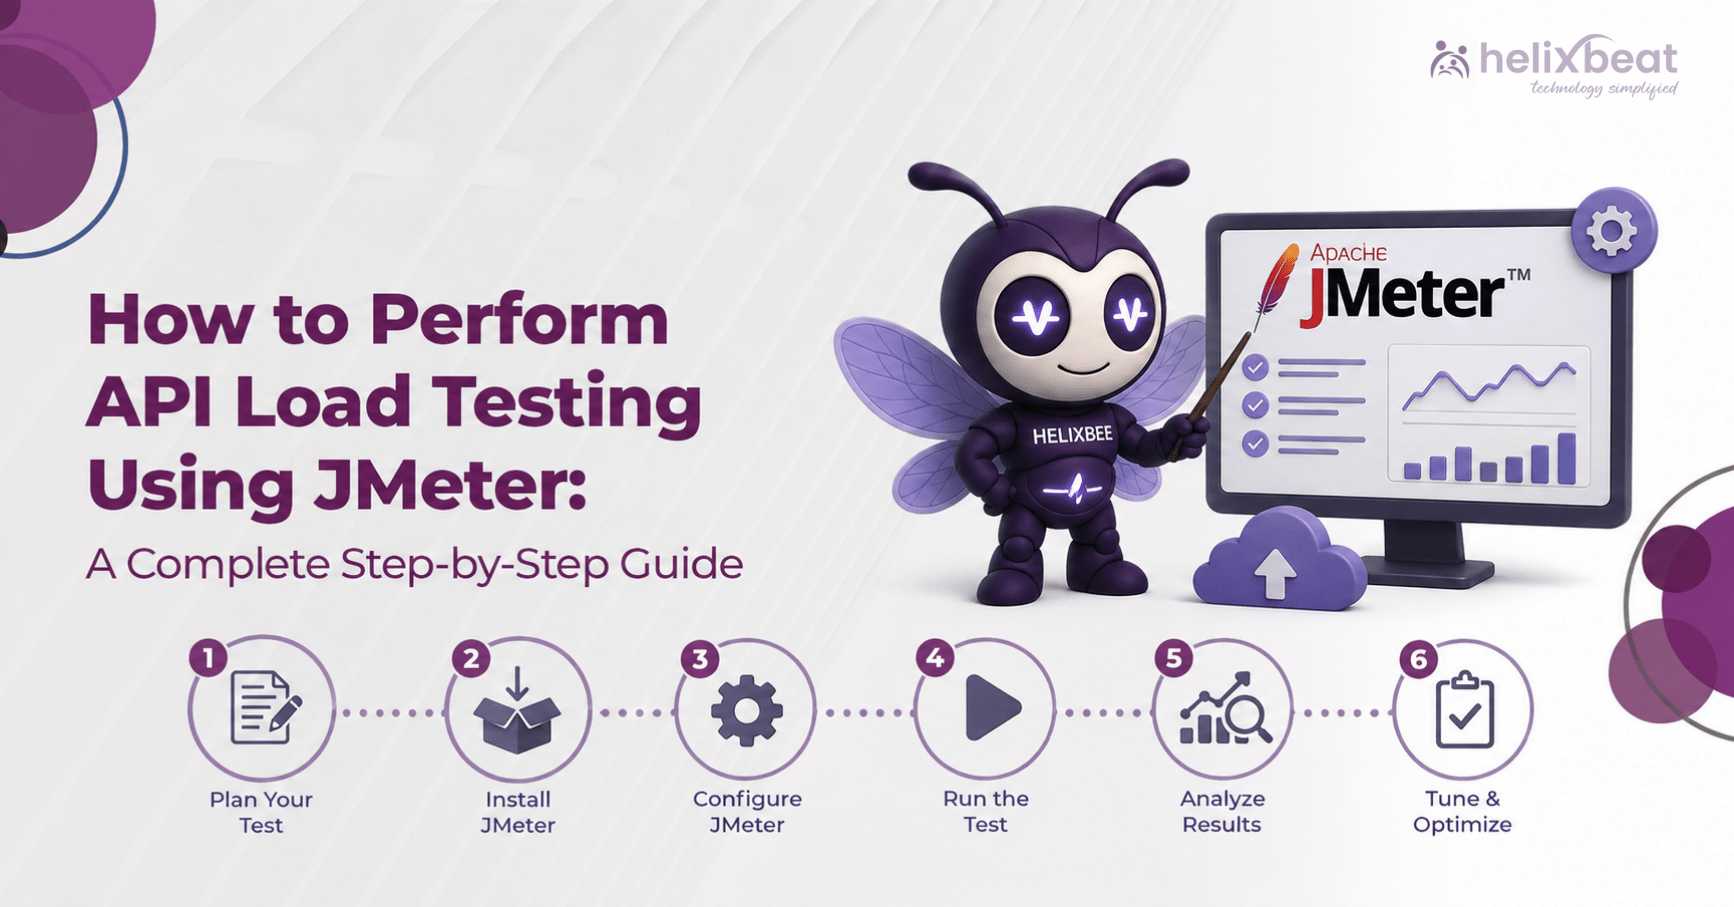
How to Perform API Load Testing JMeter: A Complete Step-by-Step Guide
Every API performs well when only a handful of users access it. The real challenge begins when hundreds or thousands of requests arrive simultaneously. A payment gateway, healthcare platform, banking application, or e-commerce website cannot afford slow response times during peak traffic. This is why API load testing using JMeter is important for modern engineering teams.
Apache JMeter is an open-source performance testing tool designed to simulate concurrent users and measure how APIs respond under varying workloads. It supports REST, SOAP, GraphQL (through HTTP requests), and other web protocols.
Why Choose JMeter for API Load Testing?
Apache JMeter is one of the most trusted performance testing tools because it combines flexibility with a rich ecosystem of plugins.
Its major advantages include:
- Open-source with an active community
- Supports REST and SOAP APIs
- Distributed testing across multiple machines
- CSV-driven data parameterization
- Integration with Jenkins, GitHub Actions, and Azure DevOps
- Detailed reporting for response time, latency, throughput, and error rates
- Extensible through plugins for advanced reporting
These capabilities make JMeter suitable for startups as well as enterprise applications.
Step 1: Define Clear Performance Objectives
Before creating a JMeter script, identify what success looks like.
Questions to answer include:
- How many concurrent users should the API support?
- What response time is acceptable?
- What is the expected throughput?
- Which endpoints are business critical?
- What error rate is acceptable during peak traffic?
For example, a login API serving 5,000 concurrent users has very different performance expectations than an internal reporting API accessed only a few times each day.
Without measurable objectives, test results become difficult to interpret.
Step 2: Install Apache JMeter
Download the latest stable version of Apache JMeter from the official Apache website.
Prerequisites include:
- Java installed on your machine
- Latest JMeter binaries
- Sufficient system memory for larger workloads
After installation:
- Launch JMeter.
- Create a new Test Plan.
- Save the project before adding test elements.
- Organize test components using logical naming conventions.
A well-structured test plan becomes much easier to maintain as APIs evolve.
Step 3: Build Your JMeter Test Plan
Once JMeter is installed, the next step is to build a structured Test Plan. Think of it as the blueprint for your performance test. A well-organized Test Plan makes scripts easier to update as APIs evolve.
Start by adding a Thread Group, which represents your virtual users. Under the Thread Group, configure the following components:
- HTTP Request Defaults – Stores the base URL and common request settings.
- HTTP Header Manager – Adds headers such as Content-Type: application/json and authentication tokens.
- HTTP Cookie Manager – Handles session cookies for APIs that require authentication.
- HTTP Request Samplers – Represents the API endpoints you want to test.
- CSV Data Set Config – Reads test data from CSV files, allowing each virtual user to send unique inputs.
This modular approach reduces duplication and makes your scripts easier to maintain.
Step 4: Configure Realistic User Load
One of the biggest mistakes in API load testing using JMeter is configuring unrealistic traffic. Running 5,000 users instantly may not reflect actual production behavior.
Instead, define three key parameters:
- Number of Threads (Users): Total virtual users.
- Ramp-Up Period: Time taken to introduce those users.
- Loop Count: Number of times each user repeats the request.
For example:
- Threads: 500
- Ramp-Up: 100 seconds
- Loop Count: 10
This configuration gradually introduces traffic instead of overwhelming the server all at once.
As your testing matures, create separate scenarios for:
- Baseline testing
- Load testing
- Stress testing
- Spike testing
- Endurance (Soak) testing
Each test answers a different performance question and reveals different bottlenecks.
Step 5: Add Assertions and Timers
A successful response isn’t just about receiving an HTTP 200 status code. The API must also return valid data within an acceptable response time.
JMeter offers several assertion types, including:
- Response Assertion
- Duration Assertion
- JSON Assertion
- XPath Assertion (for XML responses)
Assertions validate both functionality and performance, helping you identify issues quickly.
Likewise, timers are equally important. If every virtual user sends requests simultaneously, the workload becomes unrealistic.
Useful timers include:
- Constant Timer
- Uniform Random Timer
- Gaussian Random Timer
These simulate natural user behavior and create traffic patterns closer to production environments.
Step 6: Execute Different Types of Performance Tests
After building the script, execute different testing scenarios.
Load Testing
Measures application performance under expected traffic levels.
Stress Testing
Pushes the API beyond its expected capacity to identify its breaking point.
Spike Testing
Introduces sudden bursts of traffic to evaluate how quickly the system adapts.
Endurance Testing
Runs the workload for several hours to identify memory leaks, resource exhaustion, or performance degradation over time.
Running all four scenarios provides a comprehensive understanding of API stability.
Step 7: Analyze the Right Performance Metrics
Generating reports is easy. Interpreting them correctly is where expertise matters.
Therefore, focus on metrics like:
- Average Response Time
- 95th Percentile Response Time
- Throughput
- Requests Per Second
- Error Percentage
- Network Latency
- CPU and Memory Utilization
- Active Threads
The 95th percentile response time is often more meaningful than the average because it highlights the experience of most users during peak traffic.
Large enterprises frequently engage API load testing consultants or a JMeter performance testing company to correlate these metrics with infrastructure performance.
Step 8: Optimize, Retest, and Compare Results
Running a load test once is rarely enough. Performance engineering is an iterative process. After identifying bottlenecks, developers should optimize the application and execute the same test again to measure the improvement.
Common optimization areas include:
- Database query optimization
- Connection pooling
- API response caching
- Thread pool configuration
- Load balancing
- Efficient logging
- Memory management
- Asynchronous processing where applicable
Maintain a record of every test execution. Comparing reports over time helps teams understand whether application performance is improving or degrading with each release.
Step 9: Integrate JMeter into Your CI/CD Pipeline
Performance testing delivers the most value when it becomes part of the software delivery lifecycle.
JMeter integrates with popular DevOps platforms like Jenkins, GitHub Actions, Azure DevOps, and GitLab CI/CD. Therefore, automated performance tests can run after every significant build, which may help teams identify regressions before code reaches production.
Best Practices for API Load Testing Using JMeter
To achieve reliable results, follow these proven practices:
- Test production-like environments whenever possible.
- Use realistic request data instead of repeating identical inputs.
- Gradually increase traffic instead of starting with extreme loads.
- Monitor server-side metrics alongside JMeter reports.
- Remove unnecessary listeners during high-load execution to reduce resource consumption.
- Run multiple test iterations to validate consistency.
- Analyze percentile response times rather than averages alone.
- Document every test scenario for future comparison.
Why Partner with Performance Testing Experts?
JMeter is a powerful tool, but extracting meaningful business insights requires experience. Enterprise applications often involve microservices, third-party integrations, authentication layers, and distributed infrastructure. Testing these environments demands careful planning and analysis.
Working with an experienced JMeter performance testing company or API testing service provider gives organizations access to proven methodologies, advanced reporting, and performance optimization expertise. From defining workloads to identifying infrastructure bottlenecks, specialists help teams move beyond raw metrics and focus on measurable business outcomes.
Helixbeat offers comprehensive performance engineering solutions, including API load testing, API testing, and software quality services. Whether you’re validating a new application or optimizing an existing platform, our experts help organizations build reliable, scalable APIs that perform under real-world traffic.
Get in touch with us!
FAQs
- What is API load testing using JMeter?
It is the process of simulating multiple users and requests to measure how an API performs under different traffic levels.
- Is Apache JMeter free to use?
Yes. Apache JMeter is an open-source performance testing tool maintained by the Apache Software Foundation.
- Can JMeter test REST APIs?
Yes. JMeter supports REST APIs through HTTP Request samplers and can send GET, POST, PUT, DELETE, and PATCH requests.
- Does JMeter support SOAP APIs?
Yes. SOAP services can also be tested using HTTP Request samplers with appropriate XML payloads.
- What metrics should I monitor during API testing?
Key metrics include response time, throughput, error rate, latency, requests per second, and percentile response times.