

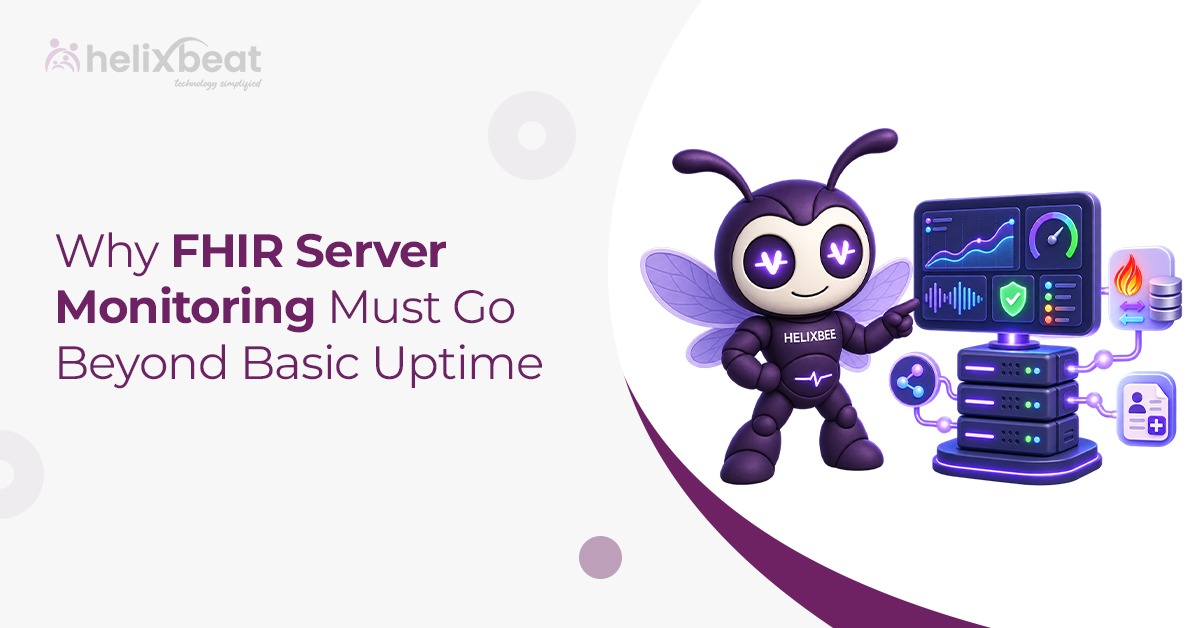
Most healthcare IT teams treat a green “server is up” dashboard as proof that everything is fine. It isn’t. A FHIR server can respond to health checks all day and still fail the people who depend on it. A clinician waits on a Patient search. A payer app pulls Explanation of Benefits data. A lab system pushes an Observation that never lands. Basic uptime tells you the lights are on. But it says nothing about whether the data flowing through the building is correct, fast, or even reaching its destination.
That gap is why FHIR server monitoring has to grow up. It needs to move from “is it alive” to “is it actually doing its job,” resource by resource, request by request.
Table of Contents
The Uptime Trap
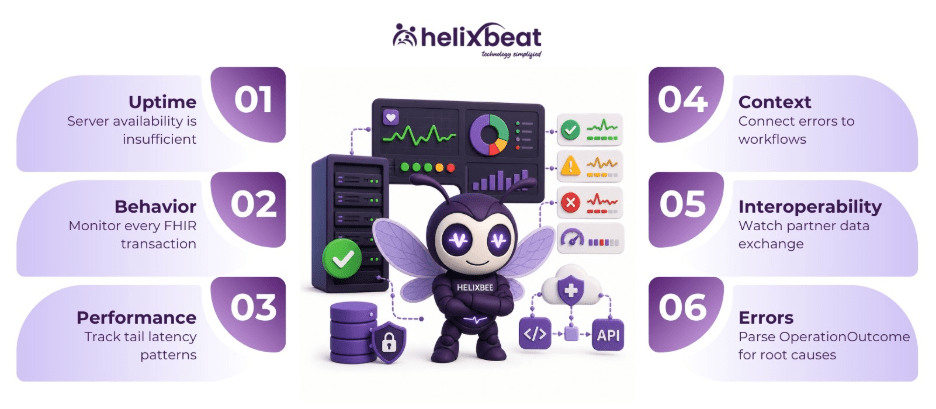
A ping check or a simple metadata endpoint hit every sixty seconds will tell you the server process is running. But it won’t tell you your terminology service is timing out. It won’t catch a FHIR version mismatch silently rejecting Bundle submissions. It won’t flag a downstream EHR throttling your requests during peak hours. Unfortunately, teams that stop at uptime often learn about problems the hard way, when a partner calls to ask why their data hasn’t updated in three days.
The server being reachable and the data being trustworthy are two different questions. They need two different sets of checks.
FHIR API Monitoring Means Watching Behavior, Not Just Availability
Real FHIR API monitoring tracks what happens inside each transaction. That includes response codes broken down by resource type. For example, a spike in 422 responses on MedicationRequest submissions points to a validation problem upstream. A rise in 404s on a specific patient-matching endpoint may point to a broken reference between systems.
It also means watching search parameter usage. The RESTful search is flexible, and that flexibility can hide performance problems. For example, a poorly indexed _include or chained search parameter can quietly turn a two-second query into a twenty-second one. That slowdown builds long before anyone notices a full outage.
FHIR Server Performance Is About More Than Response Time
FHIR server performance conversations usually start and end with average latency. That’s not enough. What matters more is latency at the 95th and 99th percentile, because those are the requests real users actually feel. A server averaging 200 milliseconds can still leave one in twenty requests waiting five seconds. That’s the request a clinician remembers.
Performance monitoring also has to account for payload size. Large Bundles put pressure on memory and network throughput. Deep _include chains do too. So does paginated search, in its own way. Teams that document these patterns tend to catch degradation before it becomes an incident.
Healthcare API Observability Needs Clinical Context
Generic infrastructure dashboards were not built with healthcare workflows in mind. That’s why healthcare API observability has to connect a slow trace or a failed request back to something meaningful. That might be an encounter, an order, a referral, or a claim. Otherwise, engineers spend hours chasing a stack trace that clinical or operations staff could have explained in one sentence.
Likewise, structured logs and distributed traces should carry correlation identifiers, not patient-identifying details. That way, a support team can follow a request across FUSION, an EHR, and a third-party app without exposing protected health information. Good observability practice keeps that correlation ID consistent across every hop.
Interoperability Monitoring Extends Past Your Own Server
A FHIR server rarely operates alone. It talks to EHRs, health information exchanges, payer systems, and SMART on FHIR apps. Increasingly, it talks to QHIN and TEFCA-connected networks too. Therefore, interoperability monitoring has to watch those relationships too.
That means tracking bulk data export job completion times and subscription or webhook delivery success rates. It also means checking whether partner systems actually consume what you send them, not just accept the HTTP 200. Today, FHIR servers extending beyond EHRs into devices, labs, and remote monitoring show how wide this surface area has become. Therefore, each added connection point is another place where a silent failure can hide.
Unlock Seamless Healthcare Interoperability with FUSION
Built by Helixbeat, FHIR server FUSION leverages RESTful APIs for seamless connectivity with legacy systems, modern EHRs, wearable devices, and telehealth platforms.
Certified Excellence
FUSION is officially certified by the Drummond Group for FHIR-based interoperability, validating its conformance with healthcare data exchange standards HL7, FHIR, and SMART on FHIR. This certification demonstrates that FUSION meets industry-recognized benchmarks for secure, standardized data exchange.
FHIR Error Tracking Requires Reading the OperationOutcome
FHIR has a built-in way to explain what went wrong: the OperationOutcome resource. However, too many monitoring setups discard it and log only the HTTP status code. But real FHIR error tracking parses that OperationOutcome. It categorizes the issue type and severity, then routes it to the right team automatically.
Therefore, a validation error on a required field is a data-quality problem for the sending system. An authorization failure is a security event. A processing exception on the server side is an engineering ticket. Grouping all of these as “an error happened” buries the signal you need to fix root causes.
Likewise, security-adjacent errors deserve particular attention. Authentication and permission failures often cluster before a larger access problem surfaces.
Building a Monitoring Practice That Actually Helps
Getting this right needs a short list of habits.
- Track errors by resource type and OperationOutcome category.
- Measure latency at the tail, not just the average.
- Correlate traces across every system a request touches.
- Watch partner-facing metrics, like bulk export completion and subscription delivery, alongside internal ones.
Organizations that treat their FHIR server as clinical infrastructure tend to invest here early.
Uptime is the floor, not the goal. FHIR server monitoring that stops at uptime is only checking whether the lights are on. Real FHIR server monitoring watches whether the data moving through those servers is fast, accurate, and actually reaching the people who need it.
Looking to strengthen your FHIR infrastructure? Get in touch with us!
FAQs
- What is FHIR server monitoring, and how is it different from regular server monitoring?
FHIR server monitoring tracks the health of the server infrastructure and the correctness of the FHIR resources and transactions moving through it. Regular server monitoring stops at CPU, memory, and uptime. It doesn’t check whether a Patient search returned complete data or a Bundle submission validated correctly.
- Why isn’t uptime a reliable indicator of a healthy FHIR server?
Uptime only confirms the server process is responding. It doesn’t confirm that searches return correct results, that resource validation is working, or that downstream systems are receiving and processing the data you send them.
- What metrics matter most for FHIR server performance?
Tail latency at the 95th and 99th percentile matters more than a single average. Search query response times, Bundle processing time, and payload size handling matter too.
- What should FHIR APImonitoringtrack beyond error rates?
It should track error rates broken down by resource type and endpoint, search parameter performance, authentication failure patterns, and response time distribution. A single aggregate success rate isn’t enough on its own.
- What is healthcare API observability, and why does it need clinical context?
Healthcare API observability is the practice of tracing and logging API activity in a way that ties back to clinical or operational meaning. That context helps teams diagnose issues quickly without exposing patient-identifying data.